Blood Pressure
Stay Ahead of the Silent Killer—One Reading at a Time
Client
Garmin
Services
Visual Design UI & UX Design
Platforms
iOS Android Web
Date
January 2023

Project
Blood Pressure
Team
1 Product Owner
1 UX Designer
2 iOS Developers
2 Android Developers
1 Web Developer
2 API Devs
3 QAs
1 Copy Writer
Timeline
8 Months
My role
Lead UX Designer, Subject Matter Research, UX | UI Design
Garmin has been adding health tracking features from wearables for years.
Starting with step tracking to more advanced features like tracking pulse oxemetry (pulse ox), advanced sleep tracking, weight monitoring, hydration and many more.
To add to its all around health monitoring, Garmin designed a blood pressure cuff (FDA-cleared medical device) to give its customer base an easy method to track an often overlooked health issue.
High blood pressure is called the silent killer after all. Even apparently healthy active, slim people could be at risk for high blood pressure.
Goals
Expand Health Ecosystem – Strengthen Garmin’s position in the health and wellness space by offering a more complete suite of biometric tracking tools.
Drive Device Integration – Encourage cross-product adoption by integrating the blood pressure monitor with Garmin smartwatches and apps, increasing customer engagement.
Differentiate from Competitors – Stand out in the wearables market by offering clinically relevant health tools that go beyond standard fitness tracking.
We did user interviews before starting design work. There was a mix of interest given that many of our users live healthy and active lifestyles. Some had strong interest because of familial health traits.
Others were more health conscious and saw value in proactive monitoring, even without existing conditions.
A few users were less engaged, feeling that blood pressure tracking didn’t align with their current needs—but were open to using it if the insights were easy to understand and tied into broader wellness goals.
My first step was to learn all about blood pressure from sources like the American Heart Association (AHA), Mayo Clinic, Harvard health and others.
Once I gathered enough knowledge to understand how blood pressure worked I turned to competitive analysis to see how other apps tracked and displayed the information.
Garmin has charts and graphs to display many kinds of data but none of the charts we had would be very helpful to display the data we wanted to show.
To show ranges and multiple readings in a single day weren't very difficult but to show that data over time was a little more tricky.

For the today view, I utilized a chart similar to what the AHA used to show the ranges of Normal, Elevated, Stage 1, Stage 2 and Hypertensive crisis in some cases. A dot would represent on an X and Y axis chart to show that day's readings.

For past data we would display a line to show the systolic and diastolic ranges of readings. Along with list cards that could take you to a more detailed view of your data.
We tested designs with different demographics that were familiar with Garmin's ecosystem, as an upsell item for existing customers. We also tested designs with customers that weren't familiar with Garmin Connect to make sure the designs were understandable to new users, we wanted to validate that the range charts were effective at conveying the information.
Being able to share your readings with your doctor was another key feature within the blood pressure feature. You could download your reports and print them or email them to your health care provider.
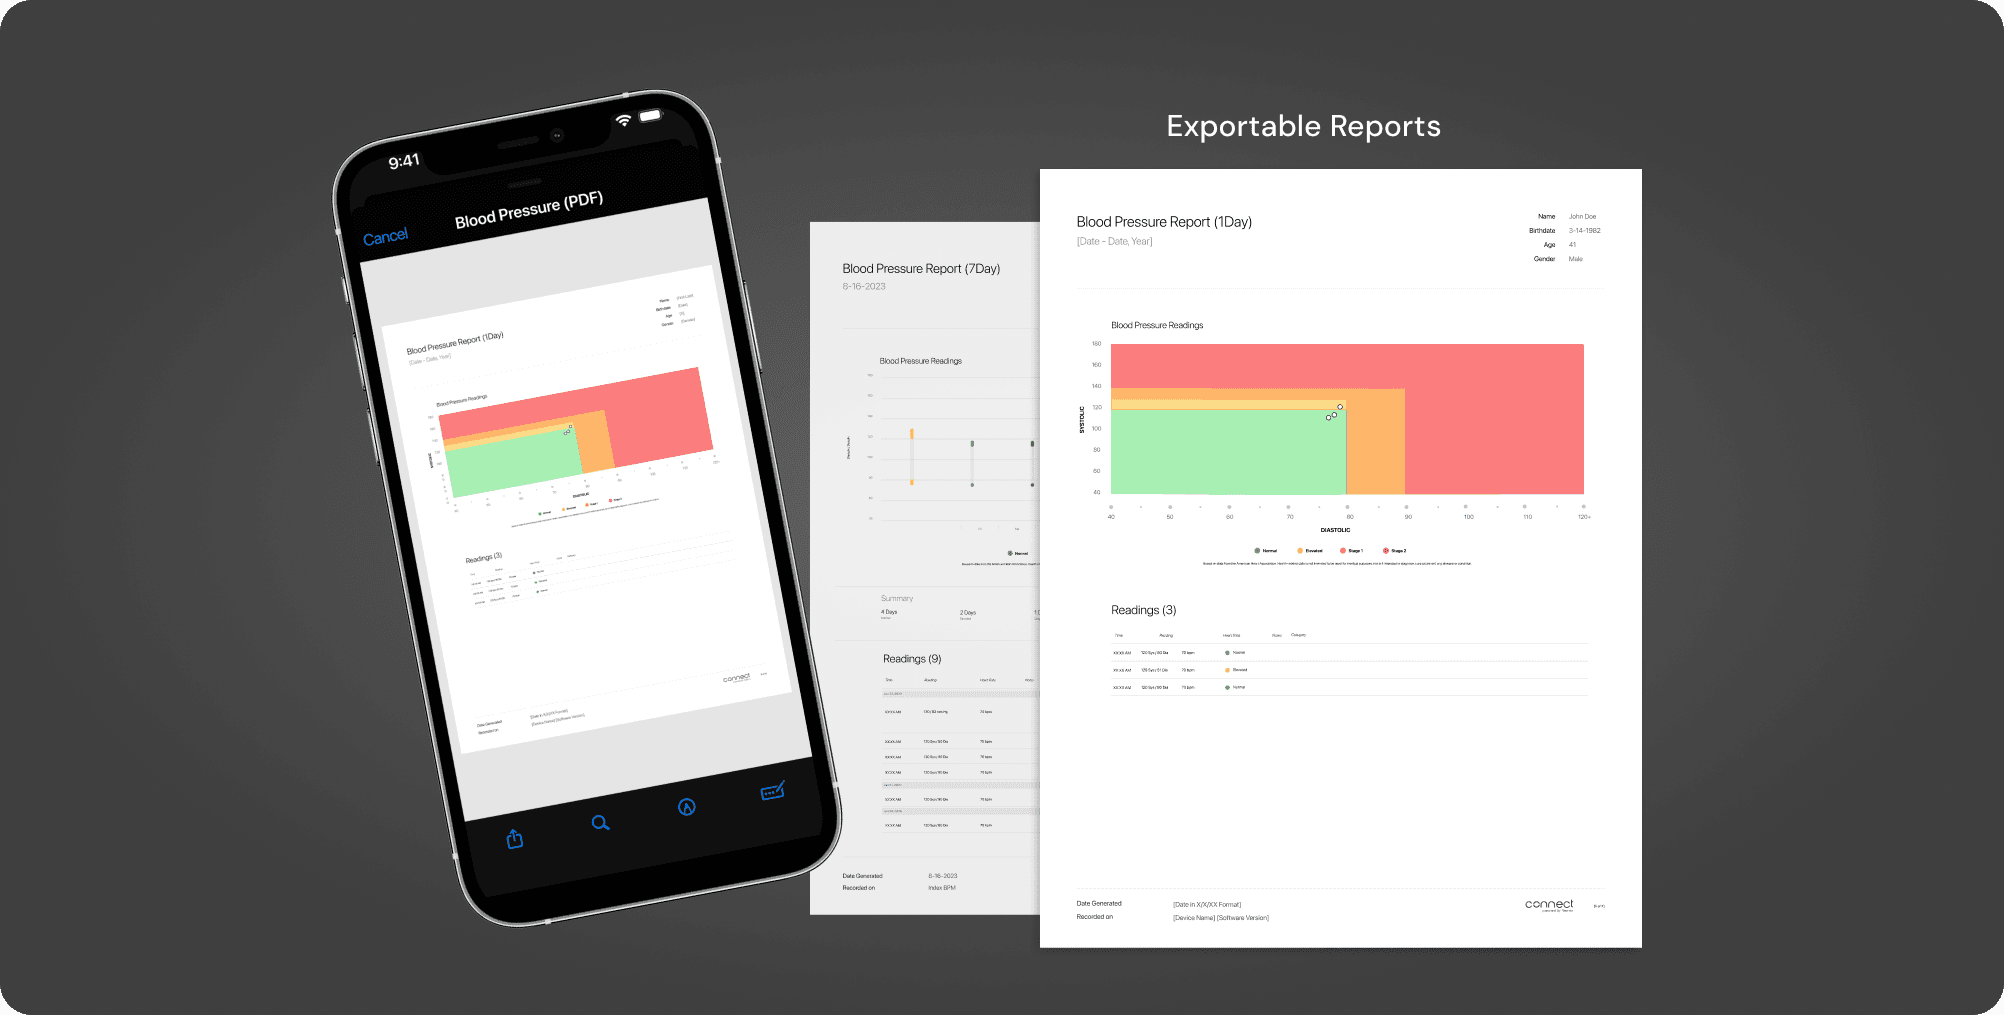
I worked closely with devs to create, implement and test the new charts and graphs. When the project was completed we took the exportable reports to other health metrics like Weight, Hydration, Pulse ox, Advanced Sleep, Menstrual cycle and pregnancy, HRV and ECG Readings.
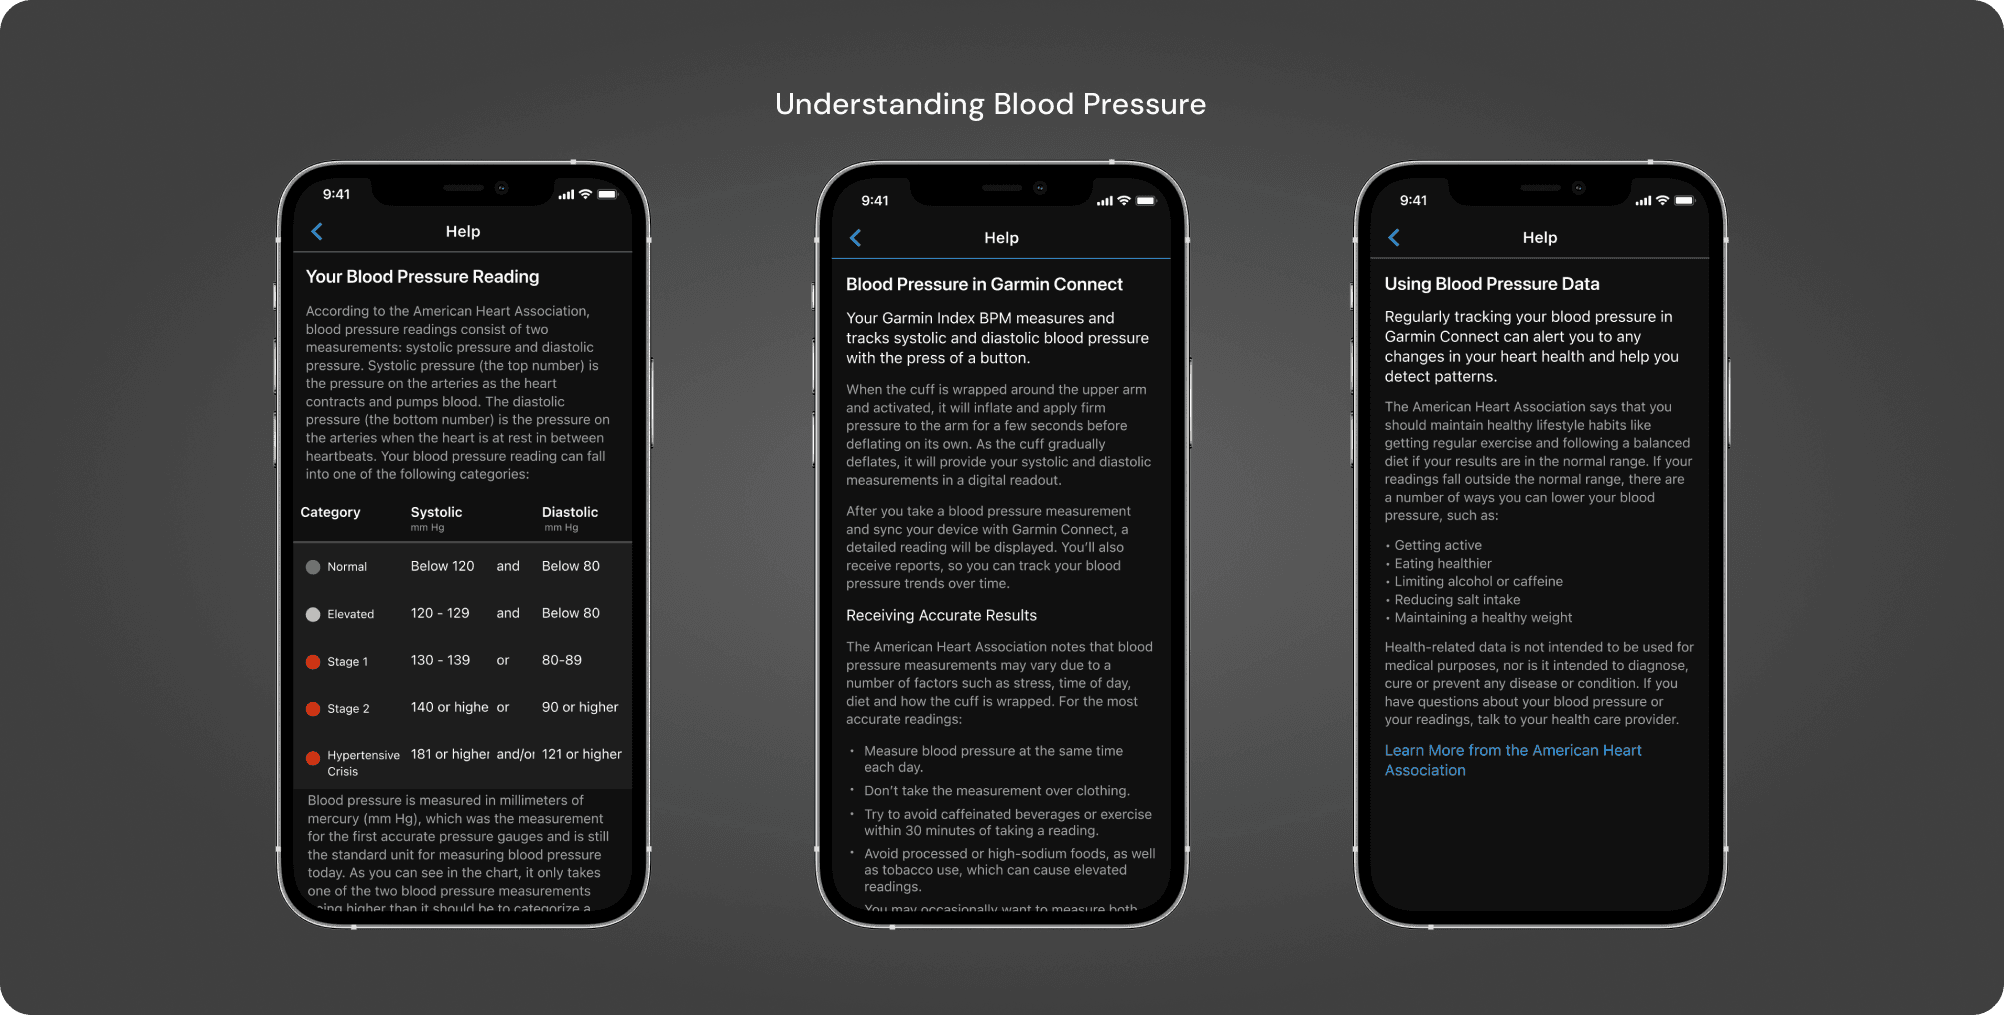
I worked with writers to ensure there was robust help content offering users clear, actionable insights to support more informed and health-conscious decisions about their well-being.
Outcomes
The implementation of the blood pressure feature led to deeper user engagement and expanded Garmin’s role in everyday health management. By integrating personalized insights and educational content, users felt more empowered to understand and act on their health data.
This not only attracted a broader audience—including those with family health concerns or existing conditions—but also reinforced Garmin’s position as a comprehensive wellness platform. The feature helped bridge the gap between fitness tracking and proactive health monitoring, creating new opportunities for long-term user retention.
Broadened appeal to users managing chronic conditions or with a family history of hypertension
Enhanced retention as users found more daily value in proactive health tracking tools
Strengthened Garmin’s health ecosystem by connecting blood pressure data with other wellness metrics
100's of thousands of units sold in the first year it was released